The response opens in the right-hand pane as soon as the request returns: a status line on top, then four tabs — Body, Headers, Cookies and Tests. The body is highlighted according to Content-Type, JSON is reformatted for you, search covers the whole document, and binary payloads are never rendered in the editor — they are offered as a file to save. Every execution is recorded in the workspace history, so the previous response is still reachable after the next send, and Compare shows what changed between them.
Status line#
The code and status text are coloured by class: 2xx green, 3xx blue, 4xx orange, 5xx red. Next to them sit the duration in milliseconds, how much slower or faster it was than the previous send (+120 or −40), and the body size in B, KB or MB. While the request is in flight the pane shows an elapsed-time counter and Cancel, which aborts the call itself: the server sees the client go away, the post-response script does not run, nothing is written to History, and variables the pre-request script changed are not kept. If no response arrives at all — DNS, TLS, timeout — you get an error card with a title, a detail line and a short list of things to check. A failed pre-request script gets the same card, titled Request not sent — see Scripting.
Body#
The body opens in a read-only editor. The highlighting language follows Content-Type: json, xml, html, and plain text for anything else. JSON is reformatted with two-space indentation; a body that does not parse as JSON is shown exactly as received, with no repair attempts.
To copy it, use the copy icon at the right end of the tab bar, or right-click inside the body for Copy Body and Select All. Cmd/Ctrl + A selects the entire document rather than the visible part, so Cmd/Ctrl + C copies all of it.
Line wrapping and editor font size live in Settings and apply to every editor in the app.
Searching the body#
A Search field appears on the right of the tab bar while Body is open. Every match highlights as you type, and a counter next to the field shows where you are — 2/5, or No matches; in a long body the current match stays on screen. Enter jumps to the next one, Shift + Enter to the previous one, Escape clears the query and returns to the body. The arrow buttons beside the field do the same with the mouse.
Cmd/Ctrl + F after a click into the body puts the cursor in this field; anywhere else it focuses the collection search in the sidebar. The full list is on Keyboard shortcuts.
Headers, Cookies, Tests#
Headers is a key/value table with a count on the tab; a header sent several times takes one row per value.
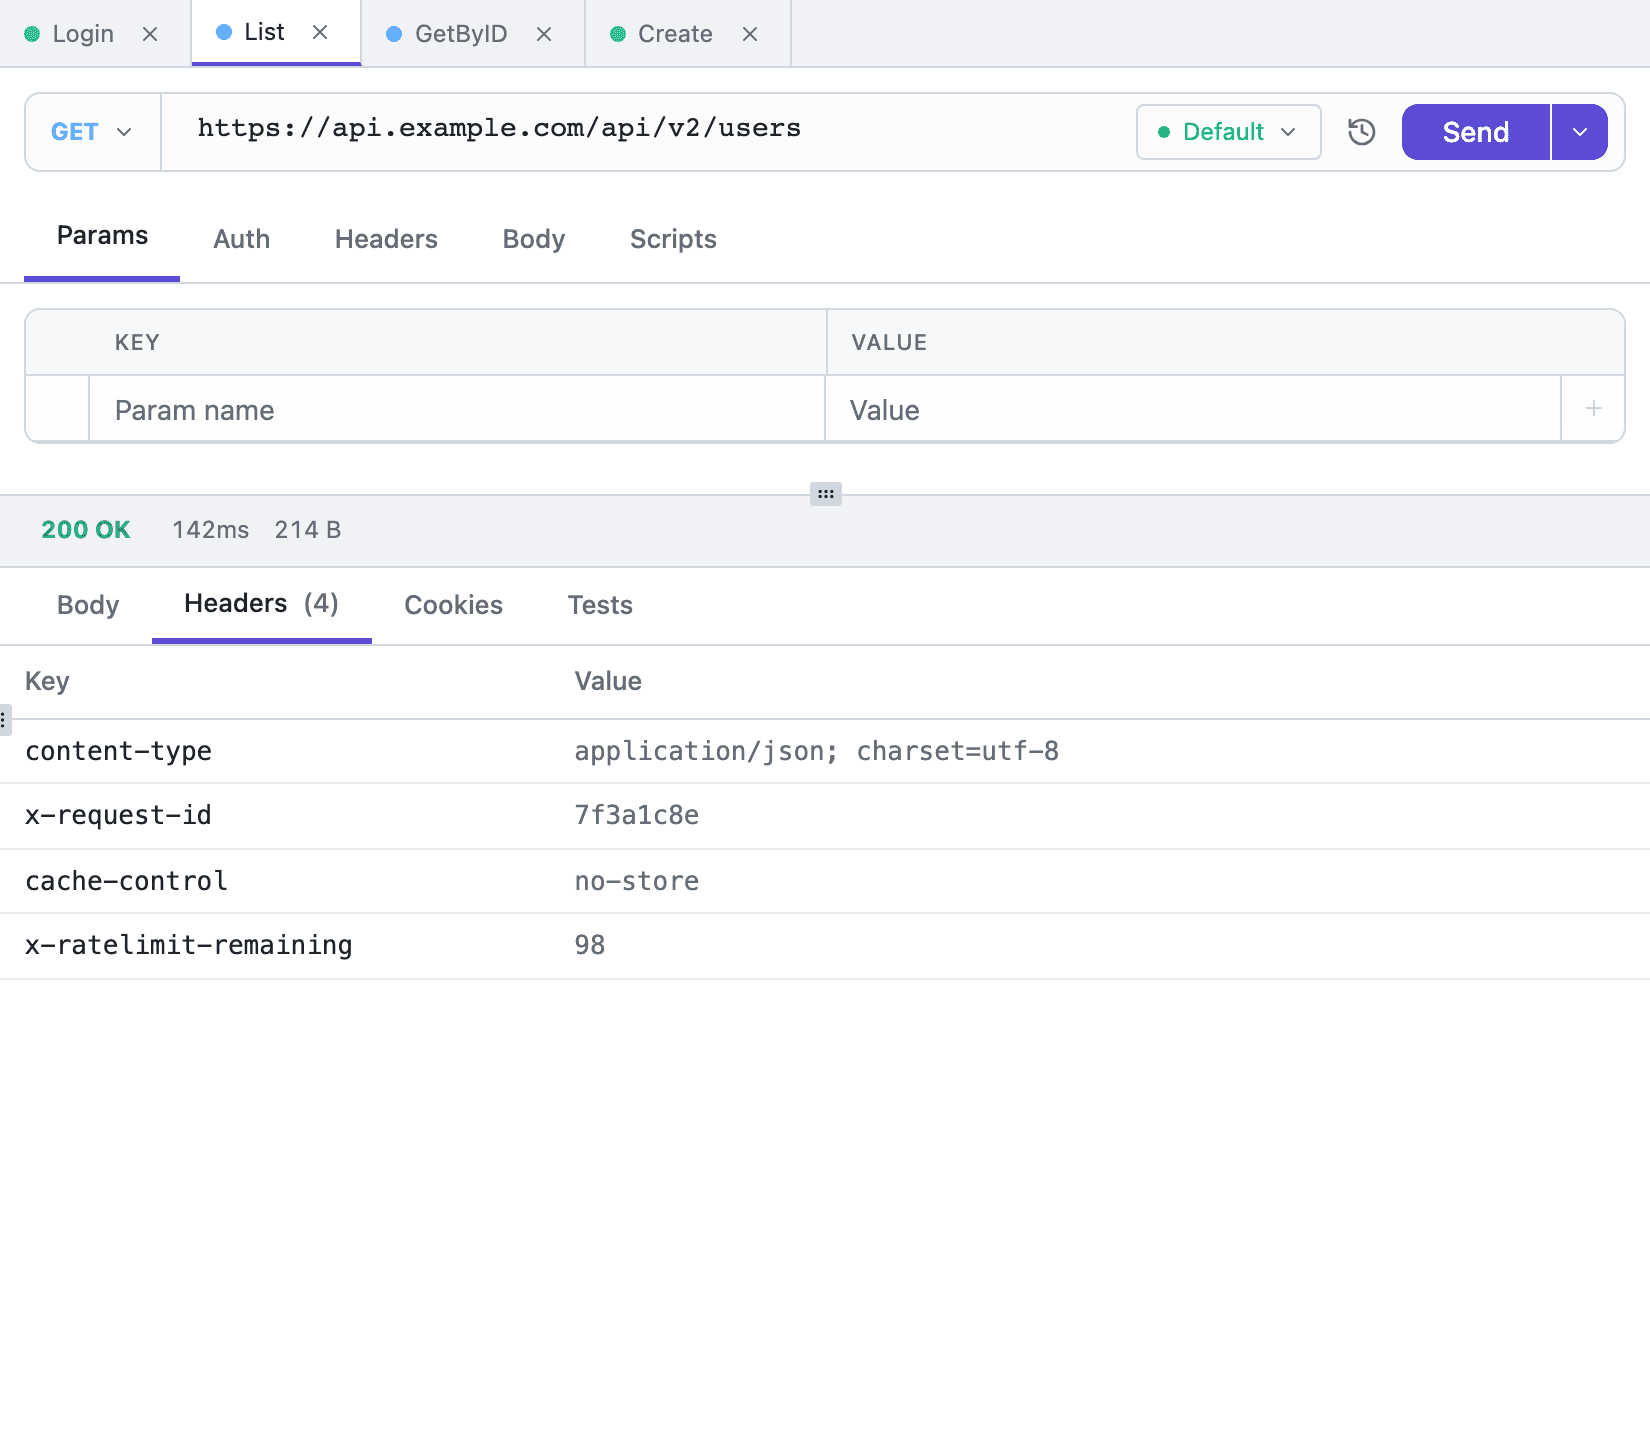
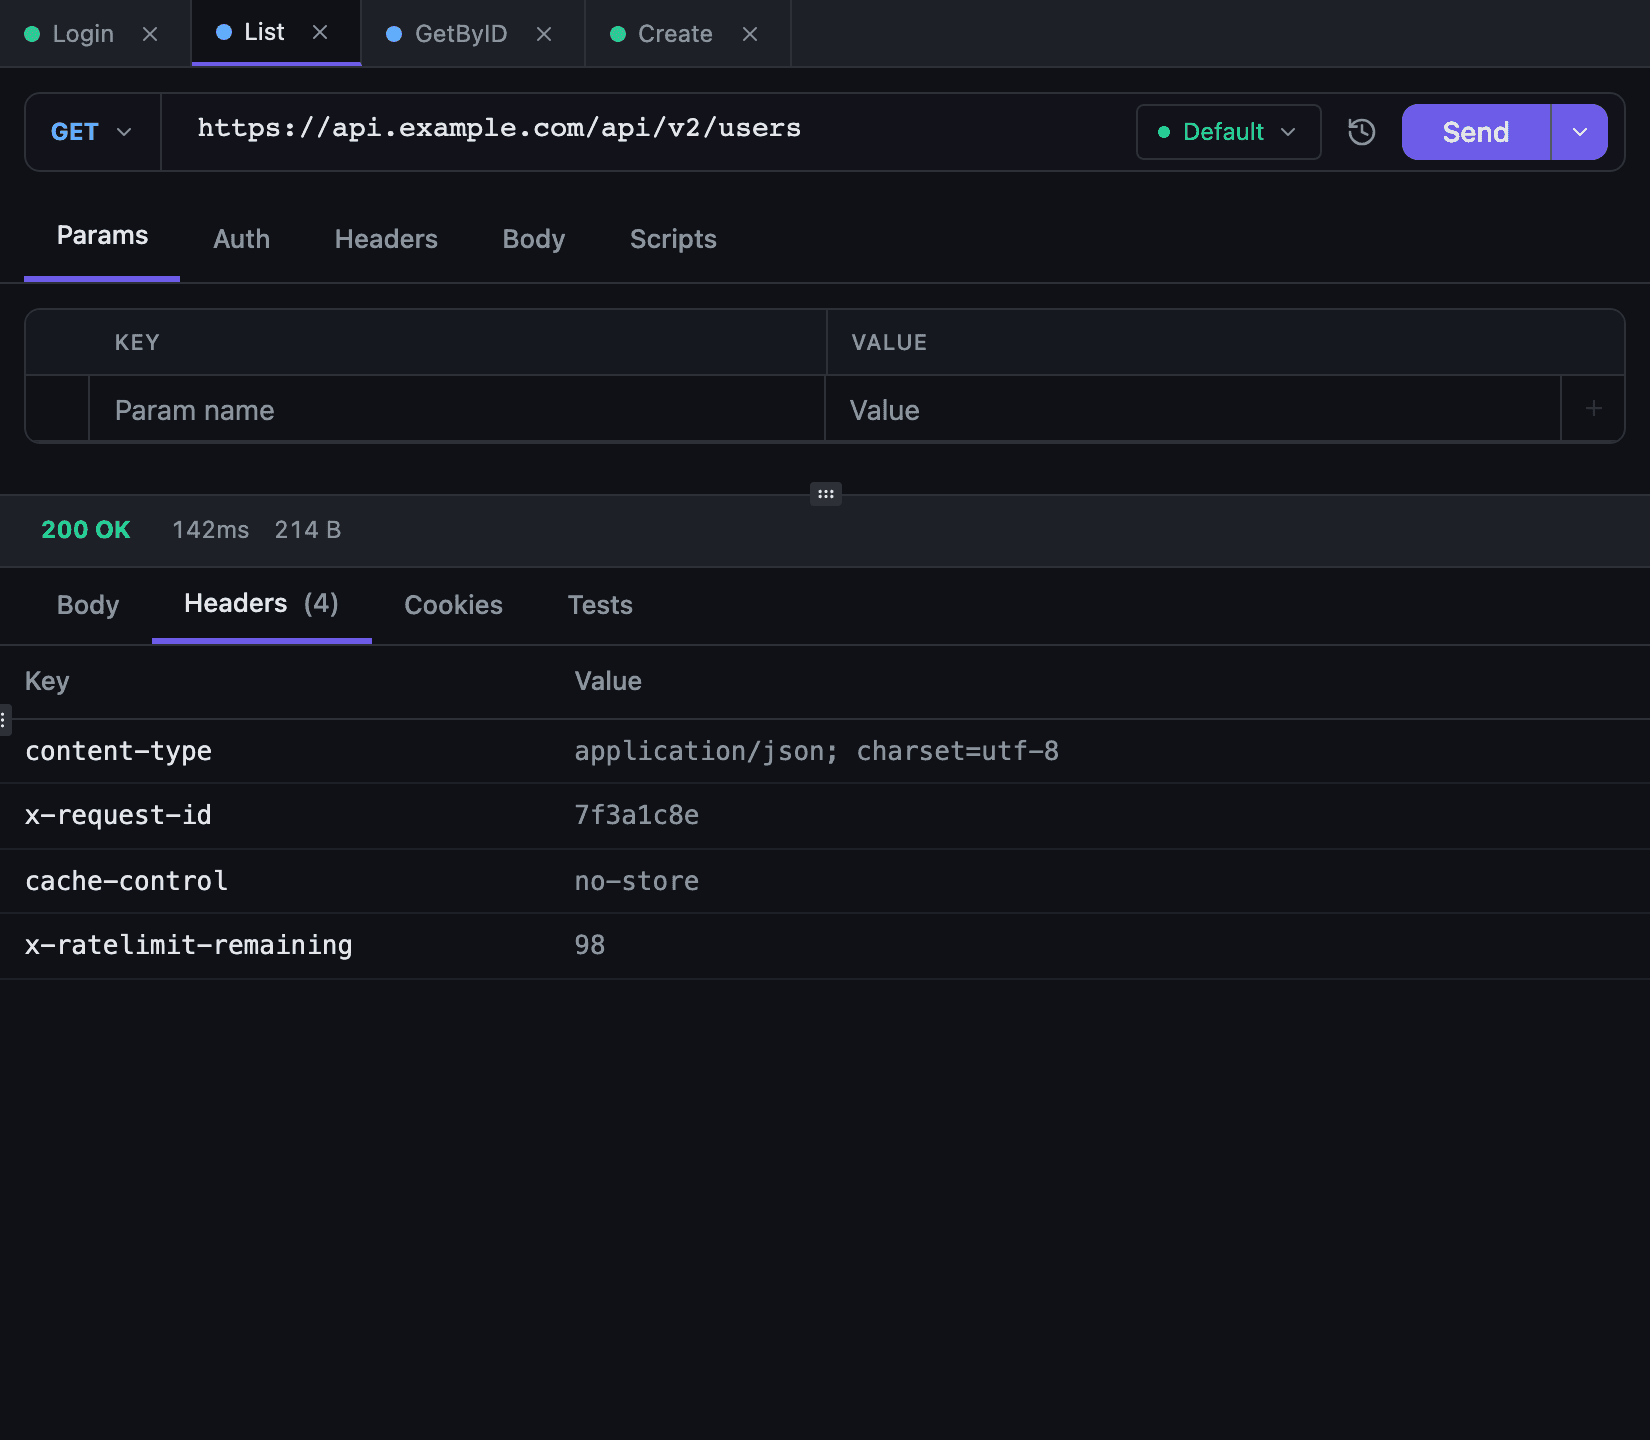
Cookies shows the Set-Cookie headers from this response together with the cookies that were sent to this address from the workspace jar. More about the jar in HTTP requests.
Tests collects pm.test results, console.log output from both script phases, and script errors. Writing those is covered in Scripting.
Large responses#
The body is read up to 50 MB; anything beyond that is dropped. An HTTP request is bounded by a 30-second timeout and ten redirects.
For payloads in the hundreds of kilobytes, search instead of scrolling — the editor renders only the visible viewport, while search runs over the whole document. Better still, assert the structure with pm.test in a post-response script and read pass/fail off the Tests tab.
Binary responses#
A response counts as binary when Content-Type says so — images, audio, video, fonts and most application/* subtypes — or when Content-Disposition: attachment arrives. Text formats are safe: text/*, application/json, application/xml, and the structured suffixes +json and +xml, so image/svg+xml stays text.
Such a body never reaches the editor. The pane shows the media type, the size and a Save to file button that opens the system save dialog. The suggested filename comes from Content-Disposition (including the RFC 5987 filename* form) or from the extension registered for that media type.
Response examples#
A response to an HTTP, GraphQL or gRPC request can be kept as an example. Save as example in the status line asks for a name and suggests the status, 200 OK for instance. The request's Examples tab lists what you saved: open, edit or delete an example there, or start an empty one with New example. Unsaved edits to an example survive a switch to another tab or window. The body is capped at 256 KB, binary responses cannot be saved, and only a saved request can hold examples.
Credential headers such as Set-Cookie, Authorization and Proxy-Authorization are masked on save. If the example still looks like it holds a secret, the app asks first: This example may contain secrets.
Examples sync between your devices and with your team. Syncing them requires server 0.19, which Tetiva Cloud already runs; an older or self-hosted server without it keeps them on the device until it is updated. Clients 1.1.1 and older do not see examples. Postman import and export carry them as response (Import and export), and a published page shows them under each request.
Comparing responses#
Compare in the status line of an HTTP, GraphQL or unary gRPC response shows what changed since the previous send of the request. The arrow next to it lists the last ten sends and the request's saved examples, so you can pick another one to compare with. The comparison has Body, Headers and Request tabs — Metadata instead of Headers for gRPC — shown Split or Unified; a narrow window starts unified. Alt + ↑ and Alt + ↓ (⌥↑ and ⌥↓ on macOS) move between changes.
Normalize JSON sorts keys and leaves timestamps, Date and X-Request-Id out of the comparison. Secret headers and query parameters show whether they were sent, never their values. Binary bodies and bodies over 1 MB are not compared, while their headers and requests still are.
In History, Cmd-click (Ctrl-click on Windows and Linux) two records and press Compare to see their requests and responses side by side. The compare icon among a record's hover actions puts it next to the current response of its request.
Request history#
Every execution is written to the workspace history — the History section in the left bar. Entries are grouped by date — Today, Yesterday, This week, Earlier — and arrive in pages of 200: Load more at the bottom pulls in older ones, and nothing caps the total. You can search by URL substring and filter by protocol (HTTP, gRPC, GraphQL, WS) and status class (2xx, 3xx, 4xx, 5xx, error).
Clicking an entry opens it read-only, with Request, Response and — when the call failed — Error tabs. The clock icon in the URL bar opens history filtered down to the current request.
A WebSocket entry holds the handshake: code 101 on success, or whatever status a refused one returned — 401 and 403 are the usual ones — the request headers as the app resolved them, the response headers and the connection time. Session messages are not stored — see WebSocket.
Replay turns an entry into a draft you can edit and send, or save into a collection; the tab is titled Replay: <address>, and a banner on it says its auth and credential headers were left out. Scripts and auth are not restored, and credentials are stripped on purpose: the draft's auth type is None, every credential header (Authorization, Cookie, X-API-Key, X-Auth-Token and the like) is removed, and so are query parameters named like credentials, such as token or api_key, and those auth added. In history recorded from 1.3 on, the header an API key went out in under a custom name, such as appid, is removed too. History stores the request as it was resolved before transport, not a copy off the wire — cookies from the jar, the Digest authorization and the AWS signature are added after that point, and a GraphQL entry keeps the query text before variable substitution — see Authentication. The trash icon on hover removes one entry; Clear all in the section header wipes the workspace history.